
IMPORTANT THINGS TO TO KEEP IN MIND:-
Strength of Materials: Stress and strain, stress-strain relationship and elastic constants, Mohr’s
circle for plane stress and plane strain, thin cylinders; shear force and bending moment diagrams;
bending and shear stresses; deflection of beams; torsion of circular shafts; Euler’s theory of
columns; strain energy methods; thermal stresses.
BOOK TO FOCUS: R.C. STREPHENS
SS RATAN
N.M. BELYAY
Mechanics of Solids or Strength of Materials is a popular branch of Engineering Mechanics. It deals with the relation of externally applied loads and its internal effect on the bodies. In general study we assume bodies and objects to be rigid but in Mechanics of Solids we do consider the deformation/deflection however small they may be. Modern Mechanics have many fields and/or types e.g quantum mechanics, fluid mechanics, engineering mechanics, automotive mechanics etc.
The subject of mechanics of materials involves analytical methods for determining the strength, stiffness (deformation characteristics), and stability of the various members in a structural system. The behavior of a member depends not only on the fundamental laws that govern the equilibrium of forces, but also on the mechanical characteristics of the material. These mechanical characteristics come from the laboratory, where materials are tested under accurately known forces and their behavior is carefully observed and measured. For this reason, mechanics of materials is a blended science of experiment and Newtonian postulates of analytical mechanics.
Applications of Strength of Materials
- To design a structure. In design of a structure the engineer must consider:
- Dimensions
- Type of Material
- Costs
- To fulfill the requirements of strength and rigidity

Uniaxial stress is expressed by

where F is the force [N] acting on an area A [m2].[3] The area can be the undeformed area or the deformed area, depending on whetherengineering stress or true stress is of interest.
- Compressive stress (or compression) is the stress state caused by an applied load that acts to reduce the length of the material (compression member) along the axis of the applied load, it is in other words a stress state that causes a squeezing of the material. A simple case of compression is the uniaxial compression induced by the action of opposite, pushing forces. Compressive strength for materials is generally higher than their tensile strength. However, structures loaded in compression are subject to additional failure modes, such as buckling, that are dependent on the member's geometry.
- Tensile stress is the stress state caused by an applied load that tends to elongate the material along the axis of the applied load, in other words the stress caused by pullingthe material. The strength of structures of equal cross sectional area loaded in tension is independent of shape of the cross section. Materials loaded in tension are susceptible to stress concentrations such as material defects or abrupt changes in geometry. However, materials exhibiting ductile behavior (most metals for example) can tolerate some defects while brittle materials (such as ceramics) can fail well below their ultimate material strength.
- Shear stress is the stress state caused by the combined energy of a pair of opposing forces acting along parallel lines of action through the material, in other words the stress caused by faces of the material sliding relative to one another. An example is cutting paper with scissors or stresses due to torsional loading.
Strength terms[edit]
Mechanical properties of materials include the yield strength, tensile strength, fatigue strength, crack resistance, and other characteristics.[5]
- Yield strength is the lowest stress that produces a permanent deformation in a material. In some materials, like aluminium alloys, the point of yielding is difficult to identify, thus it is usually defined as the stress required to cause 0.2% plastic strain. This is called a 0.2% proof stress.[6]
- Compressive strength is a limit state of compressive stress that leads to failure in a material in the manner of ductile failure (infinite theoretical yield) or brittle failure (rupture as the result of crack propagation, or sliding along a weak plane - see shear strength).
- Tensile strength or ultimate tensile strength is a limit state of tensile stress that leads to tensile failure in the manner of ductile failure (yield as the first stage of that failure, some hardening in the second stage and breakage after a possible "neck" formation) or brittle failure (sudden breaking in two or more pieces at a low stress state). Tensile strength can be quoted as either true stress or engineering stress, but engineering stress is the most commonly used.
- Fatigue strength is a measure of the strength of a material or a component under cyclic loading,[7] and is usually more difficult to assess than the static strength measures. Fatigue strength is quoted as stress amplitude or stress range (), usually at zero mean stress, along with the number of cycles to failure under that condition of stress.
 ), usually at zero mean stress, along with the number of cycles to failure under that condition of stress.
- Impact strength, is the capability of the material to withstand a suddenly applied load and is expressed in terms of energy. Often measured with the Izod impact strength test orCharpy impact test, both of which measure the impact energy required to fracture a sample. Volume, modulus of elasticity, distribution of forces, and yield strength affect the impact strength of a material. In order for a material or object to have a high impact strength the stresses must be distributed evenly throughout the object. It also must have a large volume with a low modulus of elasticity and a high material yield strength.[8]
Strain (deformation) terms[edit]
- Deformation of the material is the change in geometry created when stress is applied (as a result of applied forces, gravitational fields, accelerations, thermal expansion, etc.). Deformation is expressed by the displacement field of the material.
- Strain or reduced deformation is a mathematical term that expresses the trend of the deformation change among the material field. Strain is the deformation per unit length.[10]In the case of uniaxial loading the displacements of a specimen (for example a bar element) lead to a calculation of strain expressed as the quotient of the displacement and the original length of the specimen. For 3D displacement fields it is expressed as derivatives of displacement functions in terms of a second order tensor (with 6 independent elements).
- Deflection is a term to describe the magnitude to which a structural element is displaced when subject to an applied load.
- Many mechanical properties of materials are determined from tests, some of which give relationships between stresses and strains.
- Strength of materials deals with the relations between the external forces applied to elastic bodies and the resulting deformations and stresses.
- In the design of structures and machines, the application of the principles of strength of materials is necessary if satisfactory materials are to be utilized and adequate proportions obtained to resist functional forces.
- Forces are produced by the action of gravity, by accelerations and impacts of moving parts, by gasses and fluids under pressure, by the transmission of mechanical power, etc.
Stress and strain
Stress: When a material in subjected to an external force, a resisting force is set up within the component. The internal resistance force per unit area acting on a material is called the stress at a point. It is a scalar quantity having unit.
Types of Stresses:
- Normal stress

- Shear Stress

- Bulk Stress

Strain: It is the deformation produced in the material due to simple stress. It usually represents the displacement between particles in the body relative to a reference length.

Types of Strains:
- Normal Strain


Since strain is m/m it is dimensionless.
- Shear strain

Note: The angle is radians, not degrees. The volume of the solid is not changed by shear strain.
- Bulk Strain

Stress – Strain Relationship
Graph between stress-strain is shown in below figure. In brittle materials there is no appreciable change in rate of strain. There is no yield point and no necking takes place. The specimen is loaded only upto point A, is gradually removed the curve follows the same path AO and strain completely disappears. Such a behavior is known as the elastic behavior.

In the following figure (b), the specimen is loaded upto point B beyond the elastic limit E. When the specimen is gradually loaded the curve follows path BC, resulting in a residual strain OC or permanent strain.

Properties of Materials: Some properties of materials which judge the strength of materials are given below
Elasticity: Elasticity is the property by virtue of which a material is deformed under the load and is enabled to return to it original dimension when the load is removed.
Plasticity: Plasticity is the converse of elasticity. A material in plastic state is permanently deformed by the application of load and it has no tendency to recover. The characteristic of the material by which it undergoes inelastic strains beyond those at elastic limit is known as plasticity.
Ductility: Ducitility is the characteristic which permits a material to be drawn out longitudinally to a reduced section, under the action of a tensile force (large deformation).
Brittleness: Brittleness implies lack of ductility. A material is said to be brittle when it cannot be drawn out by tension to smaller section.

Malleability: Malleability is a property of a material which permits the material to be extended in all directions without rapture. A malleable material possess a high degree of plasticity, but not necessarily great strength.
Toughness: Toughness is the property of a material which enable it to absorb energy without fracture.
Hardness: Hardness is the ability of a material to resist indentation or surface abrasion. Brinell hardness test is used to check hardness.
- Brinell Hardness Number (BHN)

where, P = Standard load, D = Diameter of steel ball, and d = Diameter of the indent.
Strength: The strength of a material enables it to resist fracture under load.
Engineering Stress-Strain Curve: The stress-strain diagram is shown in figure. The curve start from origin. Showing thereby that there is no initial stress of strain in the specimen. The stress-strain curve diagram for a ductile material like mild steel is shown in figure below.
* Upto point A, Hooke’s Law is obeyed and stress is proportional to strain. Point A is called limit of proportionality.

* Point B is called the elastic limit point.
* At point B the cross-sectional area of the material starts decreasing and the stress decreases to a lower value to point D, called the lower yield point.
* The apparent stress decreases but the actual or true stress goes on increasing until the specimen breaks at point C, called the point of fracture.
* From point E ownward, the strain hardening phenomena becomes predominant and the strength of the material increases thereby requiring more stress for deformation, until point F is reached. Point F is called the ultimate point.
Elastic constants
Stress produces a strain, but how much strain is produced depends on the solid itself. The solid is then characterised by anelastic modulus that relates strain to stress.

Different types of stresses and their corresponding strains within elastic limit are related which are referred to as elastic constants. The three types of elastic constants(moduli) are:
- Modulus of elasticity or Young’s modulus (E),
- Bulk modulus (K) and
- Modulus of rigidity or shear modulus (M, C or G).
- Young’s modulus

- Rigidity modulus

- Bulk modulus


Hooke’s Law (Linear elasticity): Hooke’s Law stated that within elastic limit, the linear relationship between simple stress and strain for a bar is expressed by equations.

Where, E = Young’s modulus of elasticity, P = Applied load across a cross-sectional area.
l = Original length


Poisson’s Ratio
Poisson’s Ratio: The three stresses and strains do not operate independently. Stresses produce strains in lateral directions as the solid tries to retain its original volume. When an axial force is applied along the longitudinal axis of a bar, the length of a bar will increase but at the same time its lateral dimension (width) will be decreased so, it is called as Poisson’ ratio.


Value of Poisson’s ratio is same in tension and compression.
Volumetric Strain: It is defined as the ratio of change in volume to the initial volume. Mathematically
Volumetric strain,

Volumetric Strain Due to Single Direct Stress: The ratio of change in volume to original volume is called volumetric strain.


Volumetric strain:
For the circular bar of diameter d:

Volumetric Strain due to Three Mutually Perpendicular Stress System: When a body is subjected to identical pressure in three mutually perpendicular direction, then the body undergoes uniform changes in three directions without undergoing distortion of shape.


or 
Shear Modulus or Modulus of Rigidity:

- At principal planes, shear stress is always zero.
- Planes of maximum shear stress also contains normal stress.
Relationship between E, G, K and μ
Modulus of rigidity: 
Bulk modulus:

Analysis of Stress and Strain
We will derive some mathematical expressions for plains stresses and will study their graphical signification
in 2D and 3D.
in 2D and 3D.
Stress on Inclined Section PQ due to Uniaxial Stress: Consider a rectangular cross-section and we have to calculate the stress on an inclined section as shown in figure.
Normal stress :

Tangential stress:
Resultant stress:
Stress Induced by State Simple Shear: Induced stress is divided into two components which are given as
Normal stress:
Tangential stress:

Stress Induced by Axial Stress and Simple Shear
Normal stress:

Tangential stress:

Principal Stresses and Principal Planes: The plane carrying the maximum normal stress is called the major principal plane and normal stress is called major principal stress. The plane carrying the minimum normal stress is known as minor principal stress.

Major principal stress :

Minor principal stress :


Across maximum normal stresses acting in plane shear stresses are zero.
Computation of principal Stress from Principal Strain: The three stresses normal to shear principal planes are called principal stress, while a plane at which shear strain is zero is called principal strain.
For two dimensional stress system,
σ3 = 0,

Maximum Shear Stress: The maximum shear stress or maximum principal stress is equal of one half the difference between the largest and smallest principal stresses and acts on the plane that bisects the angle between the directions of the largest and smallest principal stress. The plane of the maximum shear stress is oriented 450 from the principal stress planes.


Principal Strain: For two dimensional strain system,

Where, e1 = Strain in x-direction, e2 = Strain in y-direction, and φ = Shearing strain relative to OX and OY.


Maximum Shear Strain: The maximum shear strain also contains normal strain which is given as

Rectangular strains Rosette are inclined 450 to each other.


Principal strains:

Mohr’s Circle
Graphically, variation of normal stress and shear stress are studied with the help of Mohr’s circle. A two dimensional Mohr’s circle can be constructed, if the normal stresses σ1 and σ2.
Normal stress:
Shear stress:


General State of Stress at an Element: The following procedure is used to draw a Mohr’s circle and to find the magnitude and direction of maximum stresses from it.


Observations from Mohr’s Circle: The following are the observations of Mohr’s circle as:
- At point M on circles σn is maximum and shear stress τ is zero.
- Maximum principal stress ≡ coordinate of M
- At point N on circle σn is minimum and shear stress τ is zero.
- Minimum principal stress ≡ coordinate of N

Where, sn Average stress
Radius of circle:

* If  , then radius of Mohr’s circle is zero and
Thin Cylinders
Stresses in Thin Cylindrical Shell
- Circumferential stress (hoop stress):
Where, p = Intensity of internal pressure, d = Diameter of the shell, t = Thickness of shell, η = Efficiency of joint
- Longitudinal stress:
Change in Dimension of a Thin Cylindrical Shell due to an Internal Pressure:
- Change in diameter:
- Circumferential strain (ε1 ):
- Change in length:
- Longitudinal strain(ε2):
- Change in volume:
Thin Spherical Shell
- Stresses in shell material:

- Change in diameter:
Where,
Lake’s Theory: Lake’s theory is based on the following assumptions.
Assumptions
- Homogeneous material.
- Plane section of cylinder, perpendicular to longitudinal axis remains under plane and pressure. Hoop stress at any section is:
Radial pressure:
- Subjected to Internal Pressure (p):
- At

- At

- At
- Subjected to External Pressure (p)
- At

- At

- At
Note Radial and hoop stresses vary hyperbolically.
Shear force and bending moment diagrams
A Shear Force Diagram (SFD) indicates how a force applied perpendicular to the axis (i.e., parallel to cross-section) of a beam is transmitted along the length of that beam. A Bending Moment Diagram (BMD) will show how the applied loads to a beam create a moment variation along the length of the beam.
Statically Determinate Beam: A beam is said to be statically determinate if all its reaction components can be calculated by applying three conditions of static equilibrium i.e.,  and
and 
Statically Indeterminate Beam: When the number of unknown reaction components exceeds the static conditions of equilibrium, the beam is said to be statically indeterminate.

Shear Force: Shear force has a tendency to slide the surface, it acts parallel to surface.
Only for distributed load not for point load.
Bending Moment: Any moment produced by forces acting on the beam must be balance by an equal opposite moment produced by internal forces acting in beam at the section. This moment is called bending moment.

Only for distributed and concentrated load not for couple.
Bending and Shear Stresses
Bending Moments and Shear Stress Distribution: Bending stress and shear stress distribution are classified in the following groups.
Bending Moment in Beam: When beam is subjected to a bending moment or bent there are induced longitudinal or bending stress in cross-section.
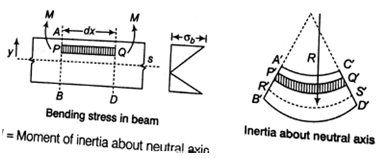
Moment of inertia about neutral axis.
At the neutral axis, there is no stress of any kind. At one side of the neutral axis, there are compressive stresses,
Modulus of Section: Section modulus is a geometric property for a given cross-section used in the design of beams or flexural members.

Rectangular section:
Modulus of section:
Circular section:
Modulus of section:
Shearing Stress: Shearing stress on a layer JK of beam at distance y from neutral axis.

Where, V = Shearing force
Shear stress in Rectangular Beam: Suppose, we have to determine the shear stress at the longitudinal layer having y distance from neutral axis.


Circular Beam: Centre of gravity of semi-circle lies at distance from centre or base line. As it is symmetrical above neutral axis, hence at neutral axis shear stress will be maximum.

For 

Shears Stress in Hollow Circular Cross-Section: In hollow circular cross-section, if we have to calculate τ at neutral axis by the formula r.
Shear Stress in Triangular Section:In a triangular cross-section, if we have to calculate τat neutral axis, then in formula
Shear Stress in I-section:


Deflection of Beams
Deflection of Beam: Deflection is defined as the vertical displacement of a point on a loaded beam. There are many methods to find out the slope and deflection at a section in a loaded beam.
Double Integration Method: This is most suitable when concentrated or udl over entire length is acting on the beam.
Integrating one time:
Integrating again,
Where,
M = Bending moment
I = Moment of inertaia of the beam section
Y = Deflection of the beame
E = Modulus of elasticity of beam material.